PicoScope 7 Automotive
Available for Windows, Mac, and Linux, the next evolution of our diagnostic scope software is now available.
Automotive guided tests
Library of examples on how to perform tests when using PicoScope.

Training
Our collection of training videos, articles, guides and information on training courses.

Waveform library
The Waveform Library is a global database of waveforms uploaded by PicoScope users.

Case studies
Real-life case studies show how the professionals use PicoScope to diagnose vehicle faults.

A to Z of PicoScope
Detailed description of various PicoScope software and hardware features.

Videos
Training resources and demonstrations on PicoScope and the Automotive Diagnostics Kit.

Newsletter
Archive of our monthly Automotive Newsletters.

Documentation
Download manuals, brochures, posters, and training materials.

Reviews and awards
Accolades for the preferred diagnostic tool for service centers and vehicle manufacturers.

Pico’s Engine and hydraulics kit is made for you to be able to diagnose problems on your equipment that relate to both engine and hydraulics. When combined with the WPS600, PicoScope gives you an unparalleled window into your hydraulic system. With the clarity of the waveforms and PicoScope’s powerful zoom functions, you can truly see what is happening in a whole new way.
The system can be used both for simple tests of purely electric signals, such as extending and retracting a hydraulic ram, to full system tests where you can investigate the state of the complete system.
The settings and connections you have to use depend on the test you want to perform and the vehicle you wish to test.
Below we have compiled some examples to illustrate what possible waveforms you may see on the screen, and what to look for during the diagnostics process.
Extending and lowering the hydraulic ram on a tractor’s three-point hitch.
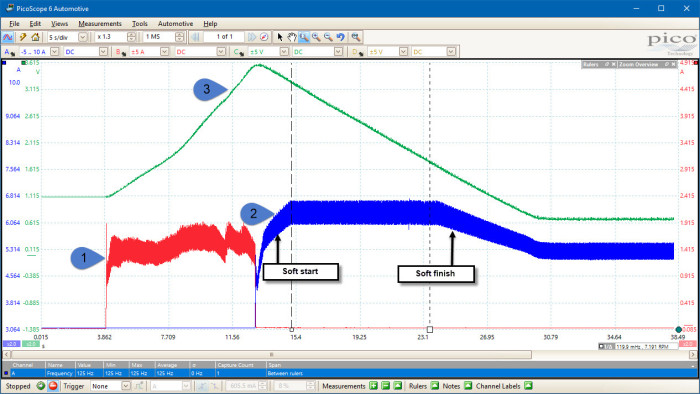
Channel A: Current on lowering solenoid
Channel B: Current on lifting solenoid
Channel C: Position sensor
Lifting operation
Lowering operation
Position sensor voltage during lifting and lowering
In this example, you can clearly see the difference in behavior in the lifting cycle. During the lifting, the operation was under the control of the operator. You can see that this waveform is quite uneven which corresponds to manual operation. During the lowering, the operation was under the control of the ECU. The waveform displays a soft start and a soft finish.
The control valves looked at in this example are both pulse width modulated (PWM) dither valves. This means that the current through them is directly proportional to the mark-space ratio of the controlling voltage signal and the mid-point current at any given time gives a direct value for the amount the valve is open or closed. The ripple on the PWM current shows the underlying frequency of the PWM signal (in this case 125 Hz).
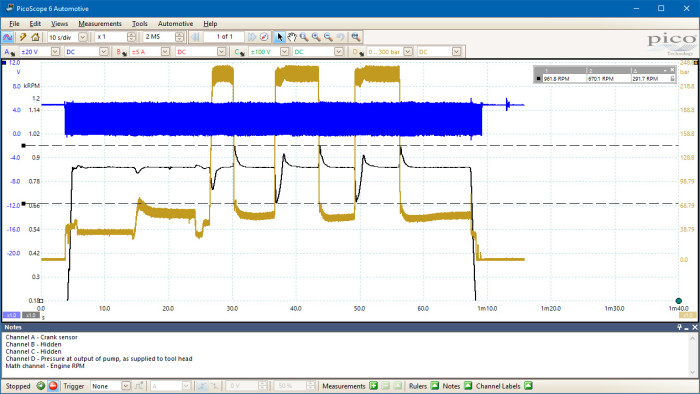
With more advanced system testing, you can explore the operation of the whole system with one capture. In the following example, we are looking at the performance of the hydraulic system on a telehandler using the TA377 300 lpm Webtec flowmeter (not included in the kit).
There is a huge amount of diagnostic information in this capture, showing both the basic operation of the system and some of the feedback controls built into this vehicle. Engine speed can be inferred from the crank speed sensor by using a measurement showing the frequency of the crank signal between two closely spaced rulers. As the crank sensor on this engine is a 60-tooth wheel, with two teeth missing, engine RPM is almost the same as the crank sensor frequency (RPM is 3.5% higher). The vehicle was sitting with the boom raised and the forks pointing down.
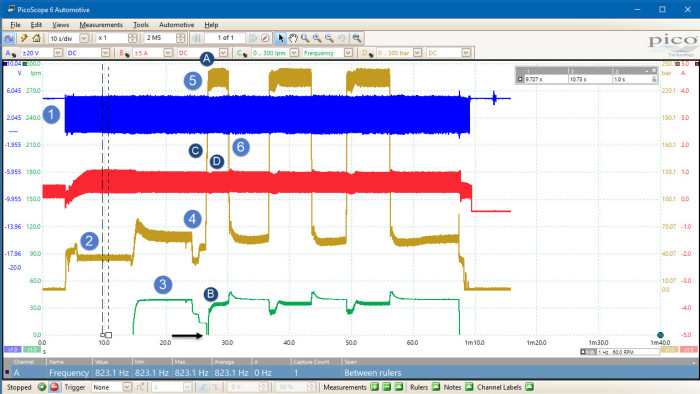
Channel A: Crank speed sensor
Channel B: Main control valve solenoid
Channel C: Flow through aux line
Channel D: Hydraulic pressure at control valve output
The engine is started – the crank sensor speeds up to its tick-over value and the hydraulic system pressurizes to its standby pressure. The dither control on the main valve starts at a minimum value and builds slowly to avoid stalling the engine.
The waveform shows a steady state, with the engine idling and only the standby flow in the internal hydraulic system to provide lubrication for the main hydraulic components.
Note: at this time there is no significant hydraulic flow in the aux line.
The aux system is turned on with the full flow rate of 30 lpm going to tank. The engine speed remains constant. The hydraulic pressure at the pump has increased to cope with the flow through the aux line.
The forks are lifted to apply some load to the system. As you can see, the flow to the ram has priority over the aux line and the flow in the aux line drops to near zero (the flow meter used had a minimum flow reading of around 15 lpm – below this value the scope trace will disappear off the bottom of the screen). As the forks start to lift, you can see the line pressure drop to near standby, as there is no real load on the forks and the standby pressure is enough to overcome gravity. As the ram reaches its end stop, you can see a small pressure-step as the soft-finish function of the ram cuts in.
With the forks fully up, the operator applies and maintains full pressure to the system to generate maximum load. As this occurs, several things happen:
From this simple test, we can see how the system’s electronic control is applied to manage the operation of the complete system.
It is important to understand that a simple-sounding fault such as “the engine stalls when a heavy hydraulic load is applied” can be down to problems with either the engine or the hydraulic system. Having the ability to directly relate the hydraulic system’s performance to engine signals such as injectors or the crank sensor can show the technician not only what is happening, but also what the ECU expects to be happening, hence highlighting an issue.
Within PicoScope 6 you can set up a math channel to plot the engine RPM as it varies. This gives you a graphical view of the behavior of the engine anti-stall system. Note in the example below we are using a lowpass filter with a 2 Hz cut-off in order to remove the peaks that come from the missing teeth in the crank sensor reluctor wheel.
Example math channel formula: “1.034*LowPass(freq(A),2)”, with Units named as “RPM” and Max Range set at “1200”.
1.034 is the correction factor to convert from 58 pulses per second from the crank sensor to RPM.
This example is from a hydraulic clutch pack changing from Clutch A to Clutch B. It clearly illustrates the real-world delays caused by the time it takes for the valve spools to move, oil to flow, and pressure to decay. Note that the entire changeover only takes 250 ms, and there is less than 200 ms between turning one solenoid on and turning the second off.

Channel A: Clutch B – pressure
Channel B: Clutch A – pressure
Channel C: Clutch B – current
Channel D: Clutch A – current
The solenoid in Clutch B is activated
The pressure in Clutch A starts to decrease
The pressure in Clutch B starts to increase
The solenoid in Clutch A is deactivated
The pressure in Clutch B plateaus until the clutch is deactivated. The pressure then rises to its full normal operating pressure
We can see that Clutch A is already engaged and that the pulse width modulated (PWM) signal to its control solenoid is active. Note: The pressure traces for the two clutches have different vertical scales.
When the clutch change is activated, the first thing that happens is that the power is turned on to Clutch B. For a short period of time nothing appears to happen. In reality, the spool physically moves in the directional control valve and oil starts to flow. Once the valve spool has moved far enough, we can see the pressure in Clutch A begin to decrease. With this clutch pack design, there is an internal gallery between the two clutches to speed operation. Initially the pressure decay is caused by oil flowing through the internal gallery and directly into Clutch B. As the hydraulic pump on this system (like many others) cannot supply the volume of oil required to fill the second clutch while already supplying oil to the first one, the system is designed to start filling the second clutch by using the oil draining from the first one.
When the second clutch comes on load (see marker 5), the pressure stabilizes while the clutch plates move. During this period the pump is still supplying oil to both clutches, but the internal gallery is making sure the pressure in the two units equalizes as quickly as possible and that the pressure in Clutch A decreases as pressure builds in Clutch B. Note that the system is configured to make this crossover time with both clutches driving as small as possible to minimize clutch slippage and wear. The behaviour of the system during this crossover period is critical to the smoothness of the changeover. If Clutch A fully disengages before Clutch B is ready, the vehicle will decelerate suddenly with a noticeable jerk. If the clutch overlap is too long you will get accelerated wear of the clutch plates, and excessive heating of the hydraulic oil.
When the solenoid in Clutch A is deactivated we see a small time delay while the valve spool moves to cut off flow to Clutch A. Once this is completed you can see that the pressure in Clutch A drops rapidly to tank pressure and that the pressure in Clutch B builds to normal operating pressure. The system is now operating normally with Clutch B fully engaged and Clutch A off.